


April 2025 Jobs Report and Q1 GDP: A Mercury Retrograde Moment
Another Unremarkable Jobs Report Overshadowed by GDP Decline


Leo McGarry: "The President's gonna look at the WBO revenue analysis and say that economists were put on this planet to make astrologers look good."
Fred: "Leo..."
Leo: "Luther. Ballpark. One year from today. Where's the Dow?"
Luther: "Tremendous. Up a thousand."
Leo: "Fred. One year from today."
Fred: "Not good. Down a thousand."
Leo: "A year from today at least one of you is gonna look pretty stupid."
- The West Wing, Season 1, Episode 1
One year from today, either economists or the Trump administration are going to look pretty stupid. We will have to wait at least another month, however, for the sudden arboreal stop in the broader labor market. Friday’s jobs report for April 2025 showed the U.S. economy created 177,000 jobs, and the unemployment rate held steady at 4.2 percent. On the surface, this stands in stark contrast to the 0.3 percent decline in GDP in Q1 2025 reported by the Bureau of Economic Analysis (BEA) last week, and the generally bad vibes. We are in what astrologers would call a Mercury retrograde moment.1 Is the U.S. economy doing fine, or is there an asteroid headed our way? Let’s dive in.
For starters, Friday’s jobs report was weaker than the headline numbers suggest. One major culprit: revisions. The “establishment” survey — the source of monthly nonfarm payroll employment counts - undergoes regular revisions as more complete data become available.2 Initial estimates are based on the 70-75 percent of reporting businesses who respond on time. As late reports come in over the following weeks and months, the BLS updates the data with more accurate counts of employment, hours, and earnings. Thus, each month’s report includes revised figures for the two prior months: the “first revision” (one month later) and the “second revision” (two months later. The updates are often significant, and can change the narrative of a given jobs report — especially during times of labor market volatility — but typically don’t make headlines.
Consider February and March. February’s initial estimate of nonfarm payroll growth was 151,000. By Friday, the estimate had been revised down by 49,000 jobs. March’s job growth was revised from 228,000 to 185,000. January’s number was revised down in prior months too, for good measure. This means over Q1, we are looking at an average monthly gain of 133,000 jobs. Solid, given the circumstances, but a far cry from the originally reported 174,000 new jobs per month. Revisions can affect specific industries as well. This month, transportation and warehousing added 29,000 jobs. Two strong months in a row! But a closer look reveals the corresponding estimate for March was revised down from 23,000 new jobs to just 3,000. Given United Parcel Service’s (UPS) announcement earlier this week of plans to cut 20,000 workers as they scale back their partnership with Amazon, the sector’s recent strength may not hold.

The Trump administration’s efforts to trim the federal workforce have also begun to show up in earnest. Federal employment declined by 9.000 in April, and has fallen by 26,000 over the past three months. Of those lost jobs, at least 7,500 have been in the Washington, D.C. metro. On the positive side, local governments across the country have continued to hire, creating over 16,000 jobs per month, with momentum among state governments as well. However, federal government employment will likely continue to decline in the months to come, with further risks to the research and education sectors following the administration’s attempts to cut funding.

Otherwise, measures from the household survey, including the unemployment rate, employment-population ratio, and labor force participation rate, held steady in April. However, an interesting longer term trend is the rise of workers with more than one job.3 During recent expansions, from 2002 to 2006, and 2010 to 2019, the multiple jobholding rate was relatively flat. Since 2020, however, the rate has steadily increased, from 4.0 percent to 5.5 percent. This rise was driven by almost 2 million additional full-time workers who had a second, part-time job.


The increase is likely tied to the rise of “gig” work and the online platform economy. Over the past five years, the number and usage of online platforms for ridesharing, food delivery, virtual services, and vacation rentals has risen dramatically. There is also evidence that before and during the pandemic recession, workers turned to these platforms for extra income to make ends meet. Should labor market conditions worsen, it will be interesting to see if participation in the “gig” economy rises in response.
The Q1 GDP Report
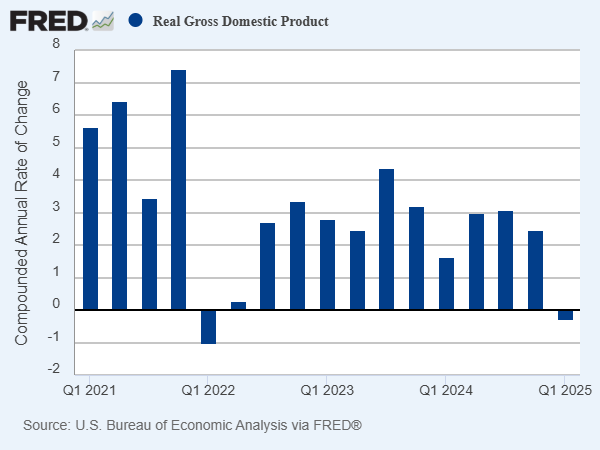
The most noteworthy piece of economic news this week was the advance estimate of Gross Domestic Product (GDP) for the first quarter of 2025, reported by the Bureau of Economic Analysis (BEA) on Wednesday. The U.S. economy declined at an annual rate of 0.3 percent in Q1 of 2025, after two and a half years of growth averaging over 2 percent. This report does not reflect positively on the Trump administration’s economy policies.
Before diving into the details, it’s important to discuss how BEA measures the size of the U.S. economy. GDP - gross domestic product - represents the total value of goods and services produced in the United States. There are a number of different ways to estimate this value, but the primary method for official estimates is called the “expenditure approach”. This method adds up all spending on final goods and services within the country during a given period, expressed using the following equation.
Using this method, the four main components of GDP are consumption (C), investment (I), government spending (G), and net exports (X-M). Consumption is typically the largest component, and includes all household spending on goods and services, such as food, rent, health care, and education. It can be broken down into durable goods (e.g. cars, appliances), nondurable goods (e.g. groceries, clothing), and services. Investment refers to business expenditures on capital goods like structures and equipment, residential construction, and changes in private inventories. It reflects efforts to increase future productive capacity rather than financial investments like stocks or bonds, which are at their core transfers of ownership.
Government spending includes federal, state, and local expenditures on goods and services such as defense, public education, and infrastructure, but excludes transfer payments like Social Security, which are counted in consumption when spent. Finally net exports is exports minus imports. Exports positively contribute to GDP since they reflect goods and services produced by American firms sold abroad. Imports are subtracted because they reflect money spent on foreign goods and services. Thus, each component captures a different facet of economic activity, and their movement provides insight into the sources of growth or contraction in the overall economy.

Turning to the data for 2025 Q1, there is a clear divergence from 2024. The BEA reported a significant increase in business investment, and an even larger decline in net exports. This was driven by a spike in imports, with consumers and businesses attempting to stock up before the Trump tariffs came into effect. According to the BEA, the increase of imports reflected increased purchases of consumer goods such as medicines and pharmaceutical products, along with computers and associated parts. The increase in investment was driven by a rise in private inventories. These rising stocks of intermediate or final goods are counted as investment because they will either be sold or used to create final products or services in the future.
Other data points reflect many concerns economists have expressed regarding the impact of Trump’s economic policies. First, consumption was muted, driven by weak durable goods spending. When households face uncertain prospects, they tend to hold off on big ticket items. A decline in federal government spending also contributed negatively to economic growth. The BEA even had to make a one-off adjustment to imports of silver bars because they were bought as an investment rather than for industrial use. Finally, the personal consumption expenditures (PCE) price index, which measures the prices of goods and services purchased by households, allowing for changes in customer behavior — like substituting cheaper goods when prices rise — increased by 3.6 percent in Q1 2025, compared with 2.4 percent in Q4 2024.

While this report was not a good omen, it’s important to remember this is the advance estimate. Like the establishment survey, GDP numbers are revised twice before they are final. Over the past thirty years, the average revision from the advance to the third and final estimate of quarterly real GDP growth was roughly 0.5 percentage points. This means the final reading for Q1 2025 could reasonably fall between -0.8 percent and 0.2 percent. Revisions to GDP also tend to be larger during times of transition or high uncertainty, as which the present definitely qualifies.
In addition, it’s unclear how the Los Angeles area Palisades and Eaton wildfires are affecting these numbers. Natural disasters have uncertain effects because the destruction of fixed assets, like homes and businesses, does not directly affect GDP or personal income. However, if consumer activities like tourism are interrupted or production capacity is diminished, those impacts would show up. Additionally, rebuilding appears as residential and non-residential investment, but may occur over many months. Delays in reporting out of California — the largest state economy — could lead to larger revisions.
Looking forward, if Trump does not significantly pare back his tariff plans, the U.S. economy will likely deteriorate in the second quarter. The import spike will dissipate, improving the U.S. trade balance and putting upward pressure on GDP, but those gains will be offset elsewhere. Businesses, after burning through their inventories, will invest less given high levels of policy uncertainty. Export-oriented firms will lose customers due to retaliatory tariffs; those serving domestic customers will be forced to raise prices due to higher import costs and produce less. A decline in revenue for American businesses means layoffs. More unemployment means lower household incomes and consumer spending, in real and possibly nominal terms. The administration’s insistence on cutting federal government spending would only add fuel to the fire.
While I could be wrong, these mechanisms form the foundation of most serious projections of the medium-term economic impacts of Trump’s economic policies. The forward-looking data we do have looks pretty abysmal. For instance, Flexport, a supply chain logistics firm profiled in the Wall Street Journal this weekend, reported China-U.S. ocean freight bookings have plummeted 60 percent in three weeks. Even an astrologer could tell you we’re in for a bumpy ride.
Onward, forward,
- Evan
In astronomy, apparent retrograde motion is when a planet appears to reverse its usually direction of motion across the sky, but it’s actually an optical illusion. This happens to Mercury about twelve weeks a year. Astrologers believe this phenomenon causes confusion, misunderstanding, or mixed messages.
Crucially, this is not the case for the Current Population Survey (CPS) - the “household” survey. The unemployment rate, labor force participation rate, etc. are not routinely revised after publication. The only exceptions are an annual re-benchmarking to updated population estimates from the Census, which affects levels, but not trends, and re-estimation of the seasonal adjustment factors.
Hat tip to Aaron Terrazas.