


State GDP 2025 Q1: Trouble in the Heartland
Agriculture Drives Weakness in the Plains States, Especially Nebraska and Iowa


John Kinsella: “Is this heaven?”
Ray Kinsella: “No. It’s Iowa” - Field of Dreams (1989)
In 2025 Q1, the United States’ gross domestic product (GDP) declined at an annual rate of 0.5 percent, after roughly three years of solid growth. Last Friday, the Bureau of Economic Analysis (BEA) released their report on Gross Domestic Product by State, giving us a first look at which regions of the country were hit the hardest. In this post, I will give an overview of regional variation in economic activity across the U.S., and discuss which states have been booming or busting in recent years. Then, I will dig into how states fared at the start of a wild 2025, and what industries are driving these regional outcomes. The TLDR is the economy has not been dreamy for much of America’s heartland.
Setting the Stage
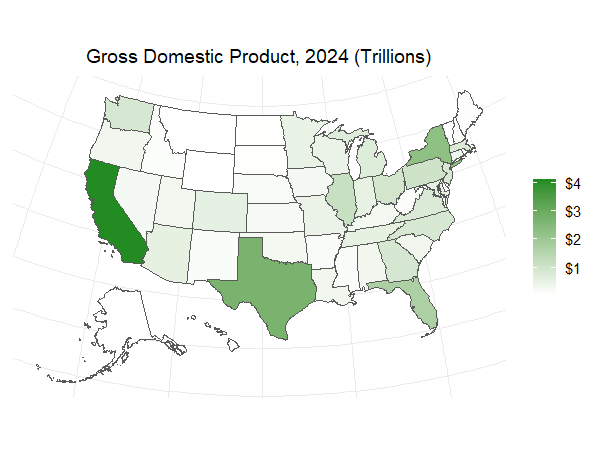
A defining feature of the United States, like many countries around the world, is stark regional variation in economic activity. California, on its own, had a GDP of over $4.1 trillion dollars in 2024. If the state were its own nation, it would be the world’s fourth largest economy, just ahead of Japan ($4.0 trillion) and behind Germany ($4.7 trillion). Texas’s economy, at $2.7 trillion, would come in at number nine globally, in between Italy ($2.4 trillion) and France ($3.2 trillion). New York state ($2.3 trillion), behind the strength of the New York City metro, takes the bronze medal. Finally, Florida ($1.7 trillion), Illinois ($1.1 trillion), and Pennsylvania ($1.0 trillion) round out the top six. The smallest state economies are Vermont ($46 billion), Wyoming ($53 billion), and Alaska ($70 billion).
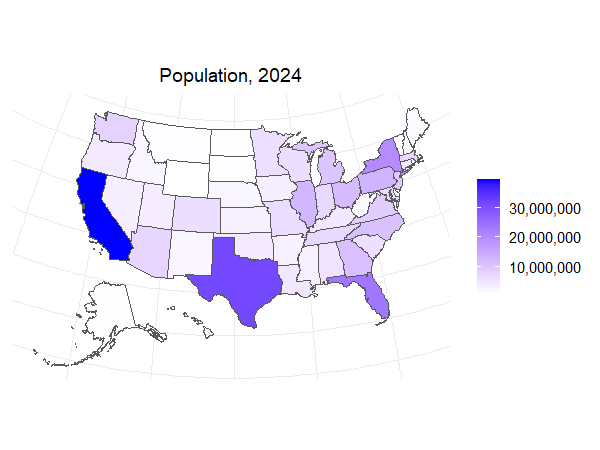
Naturally, a driving force behind these GDP numbers is population. The states with the most people have the most economic activity. Historically, the largest U.S. cities developed on the Atlantic or Pacific coasts, the Great Lakes, or the Gulf of Mexico. The primary importance of geography is visible today. At its most fundamental level, economic growth comes from one of two factors: population or productivity. In the short run, population is relatively fixed. It takes time, money, and aggravation to move across the country. But there are positive and negative feedback loops - higher productivity leads to more and better paying jobs, which incentivizes in-migration. A lack of suitable opportunities over time can lead to out-migration and brain drain.
To understand how a regional economy is performing relative to its size, economists often use GDP per capita as a rough proxy for productivity. The measure captures the value of goods and services an average worker produces, but also demographic factors, human capital levels (i.e. education, vocational training), and labor market frictions.
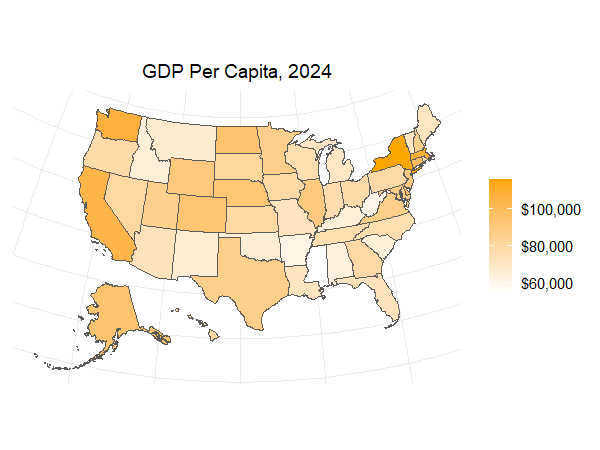
In 2024, New York was the most productive state1, with a GDP per capita of $116,000. This stems from New York City’s identity as an international business and cultural hub. The metro has a large share of college-educated workers, and a large concentrations of firms in finance, legal services, media, entertainment, and technology, along with world class universities and hospitals. But there are also a number of smaller Northeastern states, in terms of population, that perform quite well. Massachusetts ($109,000) is the second most productive state, driven by Boston’s high concentration of world-class universities and innovation in health care, biotechnology, and life sciences.
Connecticut ($99,500) and Delaware ($98,000) are ranked fifth and sixth, respectively. Today, Connecticut’s claims to fame2 are being a commuter state between New York and Boston and housing some of the most influential hedge funds in the world, like Ray Dalio’s Bridgewater Investments, in Greenwich or Stamford. But the state’s cash-strapped capital, Hartford, is nicknamed the “Insurance Capital of the World”. Delaware is known for its specialization in incorporation. Due to the state’s business-friendly laws, roughly 60 percent of Fortune 500 companies are officially incorporated there. Other sparsely populated states like North Dakota ($94,500) and Alaska (94,500) owe their high GDP per capita to the oil and gas sectors.
Florida, despite having 350,000 more residents than New York, has a significantly lower GDP per capita at $73,000 - only 34th out of fifty states. The state’s large retiree population, many of whom no longer work, pushes GDP per capita down. In addition, Florida is heavily reliant on tourism, exemplified by Walt Disney World in Orlando. However, Miami has become an increasingly popular destination for financial firms, earning the nickname “Wall Street of the South”. Going forward, Florida’s industry mix may shift towards higher-paying and more productive sectors.
Recent Trends in Economic Growth
Armed with the basic geography of economic activity across the U.S., let’s look at how different states have fared over the past few years. To do this, I will compare each state’s GDP in 2024 to its pre-COVID GDP in 2019.3 Over this five year period, the U.S. economy as a whole grew by 12.5 percent — a roughly 2.4 percent annual growth rate on average.4 While every state has surpassed its pre-COVID baseline in real terms, cumulative growth has varied from 0.9 percent (North Dakota) to 23.5 percent (Florida).
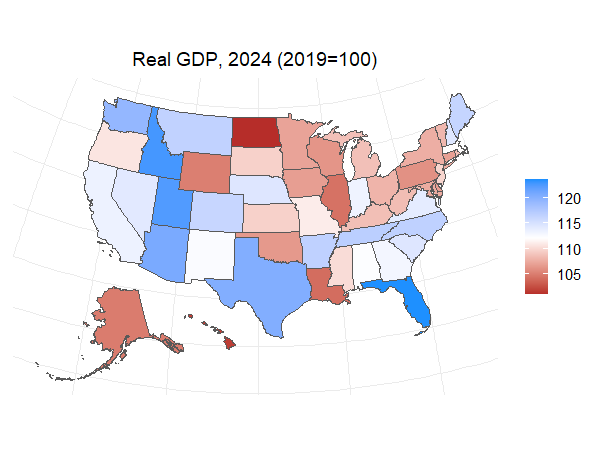
In general, economic growth has been weak across the Plains, Great Lakes, and Northeast regions. In large cities in these regions, high and rising costs of living have led to sluggish population growth. From 2020 to 2024, the New York and Chicago metros lost a net 1.1 million and 347,000 residents, respectively, to domestic out-migration. Smaller cities, especially in Ohio — Cleveland, Toledo, Youngstown — and upstate New York — Rochester, Buffalo, Syracuse — experienced similar patterns due to declining economic opportunity.
The Plains states, including Minnesota, Iowa, South Dakota, Nebraska, parts of Illinois, Kansas, and Oklahoma — were victims of a difficult stretch for the U.S. agricultural sector. From late 2020 to 2023, the region experienced severe drought conditions. Farmers also faced historically high fertilizer prices as a result of supply chain disruptions, rising natural gas and coal prices, and the Russia-Ukraine War. North Dakota’s slow growth was from agriculture, as well as a slowdown in investment and output from the Bakken Shale formation, attributed to a decline in high quality drilling sites. Alaska has also suffered from a longer-term decline in oil production, and the decimation of cruise industry post-COVID. Finally, Hawaii was hit hard by a similar decline in tourism, and the state’s recovery was further complicated by the devastating 2023 Maui wildfires.
On the positive side, Sun Belt states like Florida (23.5%), Texas (20.2%), and Arizona (20.6%) have been booming. These states offer warm weather, relatively affordable housing, and low or no state income tax. The likes of Dallas, Houston, Phoenix, Miami, Austin, and Jacksonville have been the fastest growing metros in the nation.5 Dallas is home to a number of Fortune 500 company headquarters, including AT&T, Southwest Airlines, and McKesson, a pharmaceutical and medical technology company. Houston is one of the energy capitals of the world, exporting much of the oil from the Permian Basin and the Eagle Ford Shale. It is also home to NASA’s Johnson Space Center6 and the Texas Medical Center, a healthcare and life sciences “mini-city” employing over 100,000 people. Austin is home to the flagship campus of the University of Texas, and a growing technology and startup hub. Finally, Phoenix has become one of the semiconductor capitals of America. TSMC — Taiwan Semiconductor — has invested over $40 billion in the city, spurred on in part by the Biden administration’s CHIPS and Science Act.
Idaho (22.7%) and Utah (22.3%) might be surprising states to round out the top five, but they have followed a similar playbook — affordable living, outdoor amenities (e.g. skiing, hiking), and economic opportunity — and have been successful at winning converts from coastal states like California. Boise has become a popular destination for Silicon Valley expats, and is looking forward to the opening of a Micron “fab”, or fabrication plant, and research center. In Utah, the “Silicon Slopes” region just outside of Salt Lake City hosts over 1,000 technology companies within a 50 square mile radius.
Winners and Losers in 2025 Q1
When Trump returned to the White House for a second term in January 2025, the U.S. economy reached a turning point. In the first quarter, gross domestic product declined at an annual rate of 0.5 percent, because of the administration’s scattershot tariff policy, cuts to federal spending, and the resulting economic uncertainty. GDP growth in most regions either stagnated or declined, in some cases significantly.

The Plains region was hit the hardest, especially Nebraska and Iowa. In these two states, GDP declined at an annual rate of 6.1 percent relative to 2024 Q4. Once again, the agricultural sector was the primary culprit. The economies of Nebraska and Iowa are six to seven times more dependent on agriculture than the U.S. overall.7 As a result, the sector was responsible for 4.8 percentage points of decline in Iowa, and 4.0 p.p. in Nebraska. Other states in region exposed to agriculture struggled in 2025 Q1 as well, including Montana (-4.4%), Kansas (-3.3%), South Dakota (-2.7%), and Minnesota (-2.4%). Wyoming (-4.1%) was additionally exposed to a slow quarter for the mining/oil and gas sector.

The slump in agriculture was, in part, driven by moderate drought conditions across the Midwest. However, Trump’s trade war also likely played a role. Canada, Mexico, and China are the three largest destinations for U.S. agricultural exports, each accounting for over $15 billion per year. The trio were the first to be hit by tariffs in February and March, and retaliation, especially from China, will likely prove quite painful. Even though drought conditions receded in late Spring, the outlook is not particularly rosy.

The Sun Belt fared the best in the first quarter, with South Carolina (+1.7%), Florida (+1.4%) and Alabama (+1.0%) leading the way. Their success was driven, in part, by a strong quarter for the real estate and rental and leasing sector. This industry includes real estate agencies and brokers, apartment management companies, and residential and commercial property developers. Real estate exhibited strength across the country, contributing 0.7 percentage points to national GDP growth, but led the line in Florida (+1.2 p.p.) and South Carolina (+0.9 p.p.). Alabama’s performance was driven by a strong quarter from its manufacturing sector (+0.6 p.p.).

Thus far in 2025, most of the country has experienced a stagnation or decline in economic activity. Even the previously booming Sun Belt states have seen much slower growth, while the American heartland has been struggling. As the impacts of Trump administration’s trade policy and cuts to federal spending spread throughout the economy, it is difficult to see a return to strong, stable growth in the short to medium term, especially if the labor market continues to stall.
Onward, forward.
-Evan
I have excluded the District of Columbia from this analysis. Since DC is coterminous with the city of Washington, the district’s GDP per capita is extreme outlier - much higher than that of any state.
Beyond the University of Connecticut (UCONN) national championship winning basketball teams, especially the women.
I use chain-type quantity indexes of real GDP. “Chained” estimates of real GDP adjust for inflation using changing weights from adjacent years, incorporating shifts in economic structure. This is in contrast to using a fixed-base year for price levels.
Of course, the U.S. economy declined 2.2 percent in 2020, and for the next four years grew at an annual rate of 3.6 percent.
Miami is unique among this group of metros in that its population growth is driven by international, rather than domestic, migration.
“Houston, we have a problem…”
To measure how “dependent” a state’s economy is on a particular sector relative to the nation, I use a location quotient. It is the ratio of sector x’s value added to total GDP for a state and sector x’s value added to total GDP for the nation. The agriculture location quotients are 7.0 for Nebraska and 6.3 for Iowa.